Lavaca Developer Tools: A Chrome DevTools Extension for Debugging Lavaca Apps
Lavaca Developer Tools is a Chrome DevTools extension specifically designed for debugging Lavaca apps. This free tool provides a range of features that make it easier to debug and analyze Lavaca applications.
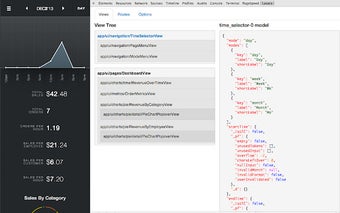
With Lavaca Developer Tools, you can easily visualize your application's view hierarchy and inspect the models associated with the rendered views. This allows you to get a better understanding of how your app is structured and how the data flows through the different views.
Additionally, the extension allows you to view the data associated with the defined routes for your application. You can see the pattern, controller type, controller action, and any additional parameters for each route. This information can be invaluable when troubleshooting routing issues or understanding the behavior of your app's routes.
Lavaca Developer Tools also provides two useful variables that can be accessed from the console. The `$view` variable represents the current view in the selected elements scope, defaulting to the view on the highest layer. The `$model` variable represents the current view's model in the selected elements scope, defaulting to the model of the view on the highest layer. These variables can be used to quickly access and manipulate the view and model data during debugging sessions.
If you're developing Lavaca apps and need a powerful debugging tool, Lavaca Developer Tools is a must-have extension for your Chrome DevTools. It simplifies the debugging process and provides valuable insights into your app's structure and data flow.


